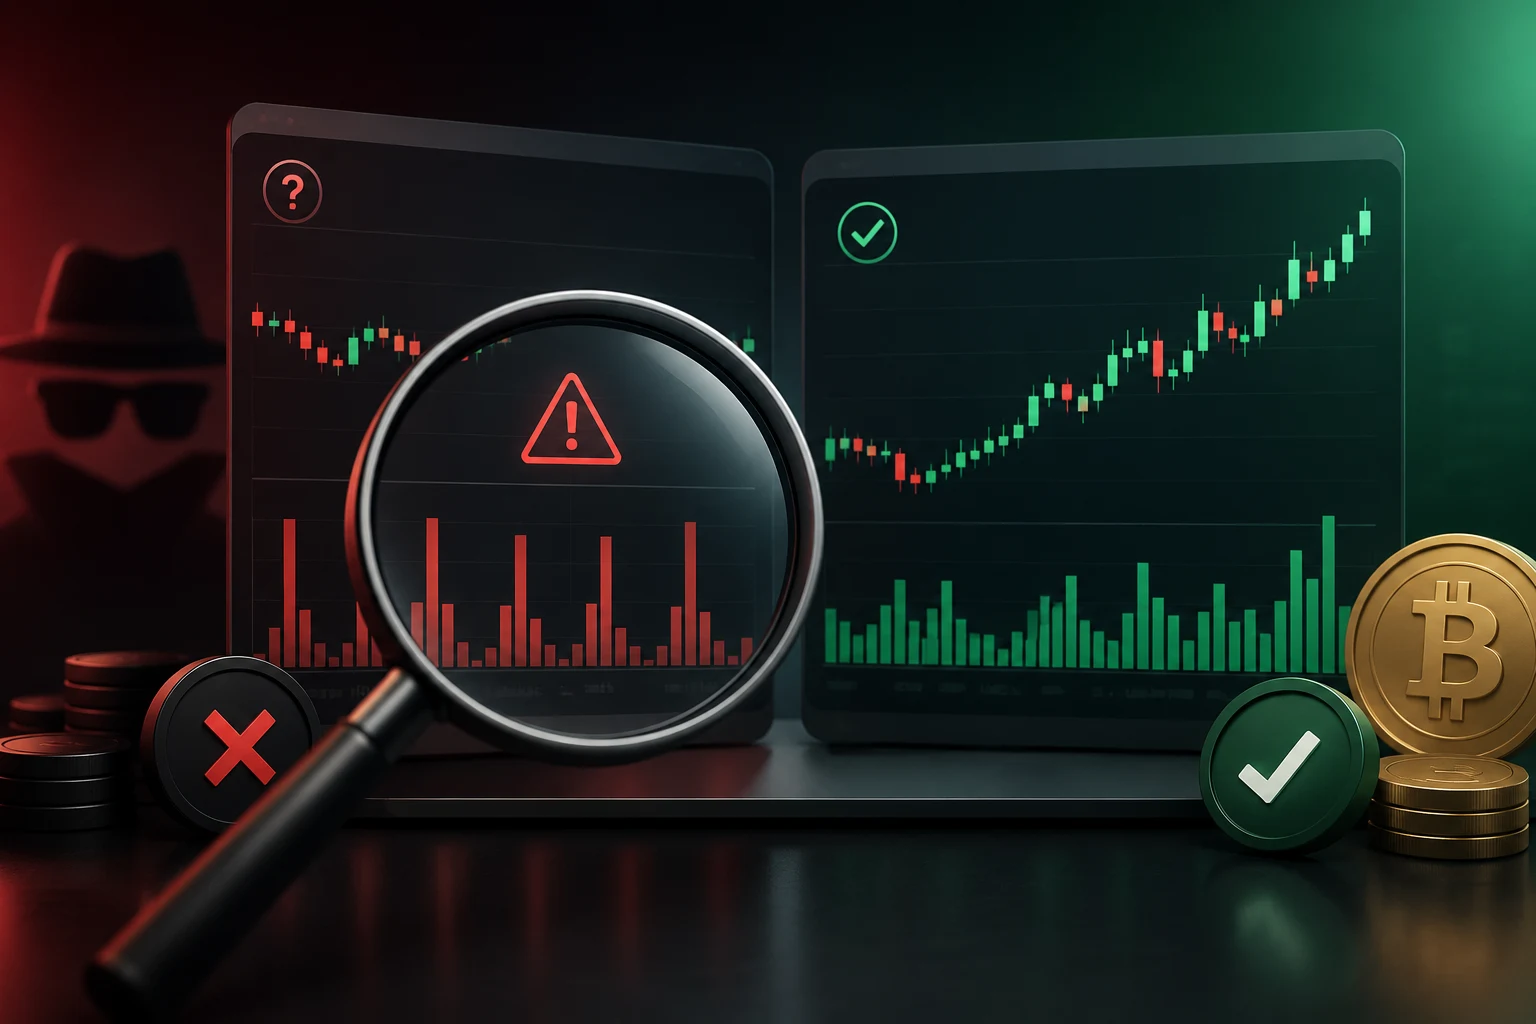
What "fake volume" actually means in crypto
The phrase "fake volume" gets thrown around in crypto Twitter the way "rug pull" did in 2021, often without a clear definition. In practice, almost all fake volume is some flavor of wash trading: one economic actor (a person, a company, a token issuer, or a bot farm) creates orders on both sides of a market and trades against itself, generating trade prints that look like organic demand.
Why would anyone do this? Three reasons, in order of how often you encounter them. First, a token issuer wants its project to rank on CoinGecko and CoinMarketCap, because retail traders use those rankings as a discovery surface. Second, a small exchange wants its BTC or ETH pairs to look busy so it can attract market makers and listing fees. Third, a bad actor wants to manufacture exit liquidity before dumping a position into the bid it just manufactured.
The mechanics are usually boring. A wash trader places a buy order at $1.00 and a sell order at $1.001, then sweeps both. The trade prints on the tape as a normal transaction, the price barely moves, and the exchange's reported volume ticks up. Repeat a few hundred thousand times per day, and a token that genuinely trades $20,000 per day can look like it trades $20 million.
This is not a victimless crime. Volume rankings drive retail flows, which drive real price impact, which can be engineered. A 2019 academic study by Chainalysis estimated that roughly 95% of reported spot volume on unregulated exchanges was wash-traded, and even on major venues, individual token pairs can be dominated by manufactured activity. The cost of not knowing is paid by the trader who chases a chart into a pair that is, mechanically, trading with itself.
Real risks of trading on a wash-traded pair
Before we get into the checklist, the risk frame matters, because this is one of those topics where the worst-case outcome is silently losing money to a market that is structurally a fraud.
The first risk is phantom liquidity. A pair can look deep on the order book and on volume charts, but when you try to actually fill size, the bids evaporate because the bids were placed by the same actor who just printed the volume. Your stop-loss, your entry, and your exit all execute at prices two to five ticks worse than the tape suggested.
The second risk is the exit-liquidity trap. Wash trading is most intense right before a token unlock, a team sell-down, or a vesting cliff, because the issuer needs buyers. The histogram of wash-trade intensity tends to spike in the four to eight weeks before any large insider distribution. A retail trader who buys on the strength of the volume signal is, structurally, the exit liquidity the wash trader is manufacturing.
The third risk is exchange insolvency, which sounds extreme until you remember FTX. A venue that reports volume it did not earn is, in a real sense, lying about its revenue, and that lie can compound into a balance-sheet problem if the team begins to spend against the inflated number. This is not theoretical. Several Tier-2 exchanges that were later exposed for wash trading (including a 2022 case where a Korean venue had roughly 99% of its reported volume flagged) had also been advertising lavish partnerships that the volume supposedly funded.
The fourth risk is data poisoning. The "trust score" on data aggregators is built from signals that wash traders can fake. If you use CoinGecko or CoinMarketCap as a discovery surface, and that surface is itself contaminated, your screening layer is compromised before you even open a chart.
How exchanges and aggregators try to detect it
CoinMarketCap and CoinGecko do not pretend to see order flow. They receive volume reports from exchanges (via API and self-reporting) and apply statistical filters. The famous "Trust Score" on CoinMarketCap is a 0-to-10 number that blends several inputs: web traffic to the exchange's site (an outside proxy for organic interest), the exchange's stated regulatory status, the gap between reported and on-chain-adjusted volume where it can be measured, and the historical incident record of the venue.
That is useful, but it has three structural limits. First, web traffic can be bought. Second, regulatory status correlates with honesty only weakly. Third, the score is exchange-level, not pair-level, so a clean exchange running a wash-heavy altcoin pair will still get a high score.
More sophisticated aggregators use additional signals. Kaiko, for example, measures the proportion of volume that occurs on regulated versus unregulated venues, and the proportion of stablecoin pair volume. CryptoCompare, another data provider, runs a "real 10" volume index that only includes exchanges meeting a set of operational criteria, and on a given day this index typically lists between 5 and 15 venues, far fewer than the 200+ that report to CoinGecko.
On the DEX side, the situation is different. AMM volume is verifiable on-chain, because every swap is a transaction with a counterparty (a liquidity pool contract) that anyone can read. The catch is that DEX volume can be inflated too, by a single deployer cycling funds through its own router. Block explorers and dashboards like Dune let you measure how much DEX volume is going through contracts deployed by the same EOA (externally owned account, a fancy phrase for a regular wallet address), which is a real signal. We will use that signal directly in the checklist below.
The five-number checklist you can run in fifteen minutes
Here is the practical part. For any pair you are considering trading, pull these five numbers and apply the rules of thumb. None of them is decisive on its own. Two or three flags at the same time is when you walk away.
1. Volume / market cap ratio (24h)
Take 24-hour reported volume in USD, divide by circulating market cap. For liquid majors like BTC and ETH, the answer is small, on the order of 0.05% to 0.3% per day, because the market caps are huge. For mid-cap altcoins, a healthy ratio is somewhere between 0.5% and 2% per day. For low-cap tokens (under $50M market cap), anything above 5% per day is a yellow flag, and anything above 15% is almost always wash trading.
Why this works: real demand on a $20M market cap token that is, say, 1% of float per day is plausible. Real demand equal to 25% of float per day is not, because there is not enough inventory to sustain it without massive price impact. Wash traders can print that volume because they are trading against themselves, so no inventory is consumed.
2. Unique makers versus trade count
Most serious charting tools (TradingView with a paid plan, Kaiko, Token Terminal) expose the ratio between the number of distinct maker addresses and the total number of fills. A healthy liquid pair might have 1 unique maker per 5 to 20 trades. A wash-traded pair often shows 1 unique maker per 1,000 or 10,000 trades, because one bot is generating every order.
On a CEX, you can sometimes see a proxy of this in the API. Some exchanges expose the count of unique "users trading" for a given pair in their 24-hour stats. If a pair shows $40M in 24h volume but only 80 unique users trading, with the average trade size being $50, that is incoherent: no human trade profile looks like that, so the volume is most likely coming from a small number of accounts posting tiny round-trip orders.
3. On-chain DEX volume versus reported CEX volume
For ERC-20 and SPL tokens, the same asset can trade on both CEX and DEX venues. Pull the 24-hour DEX volume from a reliable dashboard (Dune has community dashboards updated daily) and compare to the CEX-reported 24h volume for the same pair. If CEX volume is more than 10x the on-chain DEX volume and the CEX reports no recent large deposits or withdrawals of that token, the CEX number is likely inflated. Real CEX volume for a token that also trades on-chain tends to be in the same order of magnitude as the DEX side, plus or minus a factor of two or three.
4. Order-book depth at the top 1% of mid price
This is the single best live test of real liquidity. Look at the order book on the CEX in question, and add up the size of bids within 1% of mid and the size of asks within 1% of mid. Compare that depth to the reported 24h volume. As a rule of thumb, depth inside 1% should be at least 1% of the 24h volume. If a pair shows $50M in 24h volume but only $200,000 of depth inside 1% of mid, the volume is not real. Real $50M-per-day volume moves the book around a lot, and the resting depth reflects that churn. Wash-traded books show shallow depth because the wash trader is not actually taking risk by posting size.
5. Round-number round-trips and time patterns
Look at the last 200 trades on the tape (most exchanges expose a recent-trades feed). Wash trading shows two telltale patterns. First, the notional values cluster around round numbers, $10,000, $50,000, $100,000, because the wash script is parameterized. Organic flow shows a long-tailed distribution with weird decimals and uneven sizes. Second, the trades come in tight, regular bursts every few seconds, rather than the bursty, event-driven rhythm of real markets. Bots trade on a schedule; humans trade around news, liquidation cascades, and macroeconomic data drops.
A historical case: the 2019 Bitfinex / Tether settlement
The most consequential documented wash-trading episode in crypto history is not, as some expect, a small altcoin pair. It is the 2019 and 2021 findings around Bitfinex and Tether.
The original 2019 New York Attorney General filing alleged that Bitfinex, the parent company of which is iFinex, had covered an $850 million shortfall by drawing on Tether's reserves, and that Tether's claims about being fully backed were not supported. The subsequent 2021 settlement with the Commodity Futures Trading Commission (CFTC) found that Tether had misrepresented its reserves between 2015 and 2020, and required Tether to pay $41 million in fines. Critically, the CFTC order also noted that for a multi-year period, Tether's USDT was used to inflate volume on the Bitfinex platform, with internal chat logs showing staff explicitly discussing using Tether to "print" volume during quiet periods.
Why this matters for the checklist: the Bitfinex case is the canonical example of a venue that was so big it took a multi-year regulator investigation to prove what the numbers were already whispering. Volume on BTC and ETH pairs at Bitfinex was internally consistent (real order book, real depth, real unique makers), but the per-token pair behavior on less-liquid tokens was the giveaway. The lesson is that even a Tier-1 exchange can run a wash-traded pair on a small token, and your screening has to be at the pair level, not the venue level.
A second, more recent case is the 2022 Korean exchange investigation, where a mid-tier Korean venue was found to have roughly 99% of its reported volume come from a small cluster of accounts executing automated round-trips. The wash trade was so heavy that the public blockchain analytics firm published a report with a wallet-clustering chart showing the same handful of deposit addresses funding both sides of the order book across multiple pairs. The exchange shut down within three months of the report.
Token-issuer wash trading: the hardest case to catch
Most of the above assumes the wash trader is the exchange. The harder case is the token issuer, which controls a large treasury of its own token and can dump it into a wash-friendly exchange without ever leaving a visible footprint.
The tell here is the velocity of the token's supply, not the exchange's volume. If a token has, say, 200 million in circulating supply, and the reported 24h volume on a major CEX is $30M, but the on-chain token transfer data shows that fewer than 3 million tokens move per day across all chains, the volume is not real, because the underlying inventory is not moving. A genuine $30M-per-day market in a $200M-cap token would be visible in the on-chain token flows, especially around large centralized exchange deposit addresses.
You can check this in two ways. First, look at the token's CoinGecko or CoinMarketCap "circulating supply" and compare it to the 24h volume. If the day's volume is more than 1% to 2% of circulating supply, the velocity is suspicious. Second, look at the exchange's deposit address flows for the token (most major analytics platforms like Nansen, Glassnode, or Arkham surface these). A pair with $30M per day in volume should produce meaningful net deposits or withdrawals on a weekly basis. If the exchange's hot wallet for that token shows flat balances week over week despite huge reported volume, the volume is wash.
What to do when the flags go off
Once you have run the five numbers, the decision is usually clear. If two or more flags are red, do not trade the pair, full stop, regardless of how good the chart looks. The expected value of trading a wash-traded pair is negative, because the market structure is not a market, and your stop will not behave the way backtesting suggests.
If only one flag is yellow, the pair is not automatically bad, but you should size down by a factor of three to five, use wider stops, and avoid market orders in size. Use limit orders with post-only flags so you never pay taker fees into a market that is, mechanically, an internal matching engine.
For the broader portfolio decision, this is also why serious traders keep a personal watchlist of "exchanges I trust per pair" rather than a single venue choice. A pair that looks clean on Coinbase's BTC-USDT may not look clean on a smaller Korean venue, and you should let the per-pair verdict drive where you actually execute.
Read fake-volume claims critically from here on
Crypto news moves fast, and so do the accusations of fake volume. Most public claims of wash trading are themselves noisy: a Crypto Twitter thread, a paid research report from a competing exchange, or a regulator action that turns out to be a routine settlement. Tracking which claims hold up, and which pair-by-pair signals are getting louder, is a job, not a glance.
Zippfeed surfaces crypto headlines with sentiment scoring (bullish, neutral, or bearish) and an importance rating, so you can see which volume-related accusations are gaining traction and which are noise. The signals that matter most (exchange-specific trust updates, on-chain flow alerts, and pair-level liquidity shifts) show up there first, with the context to tell a routine dispute from a real bust in progress.