








 CoinDesk
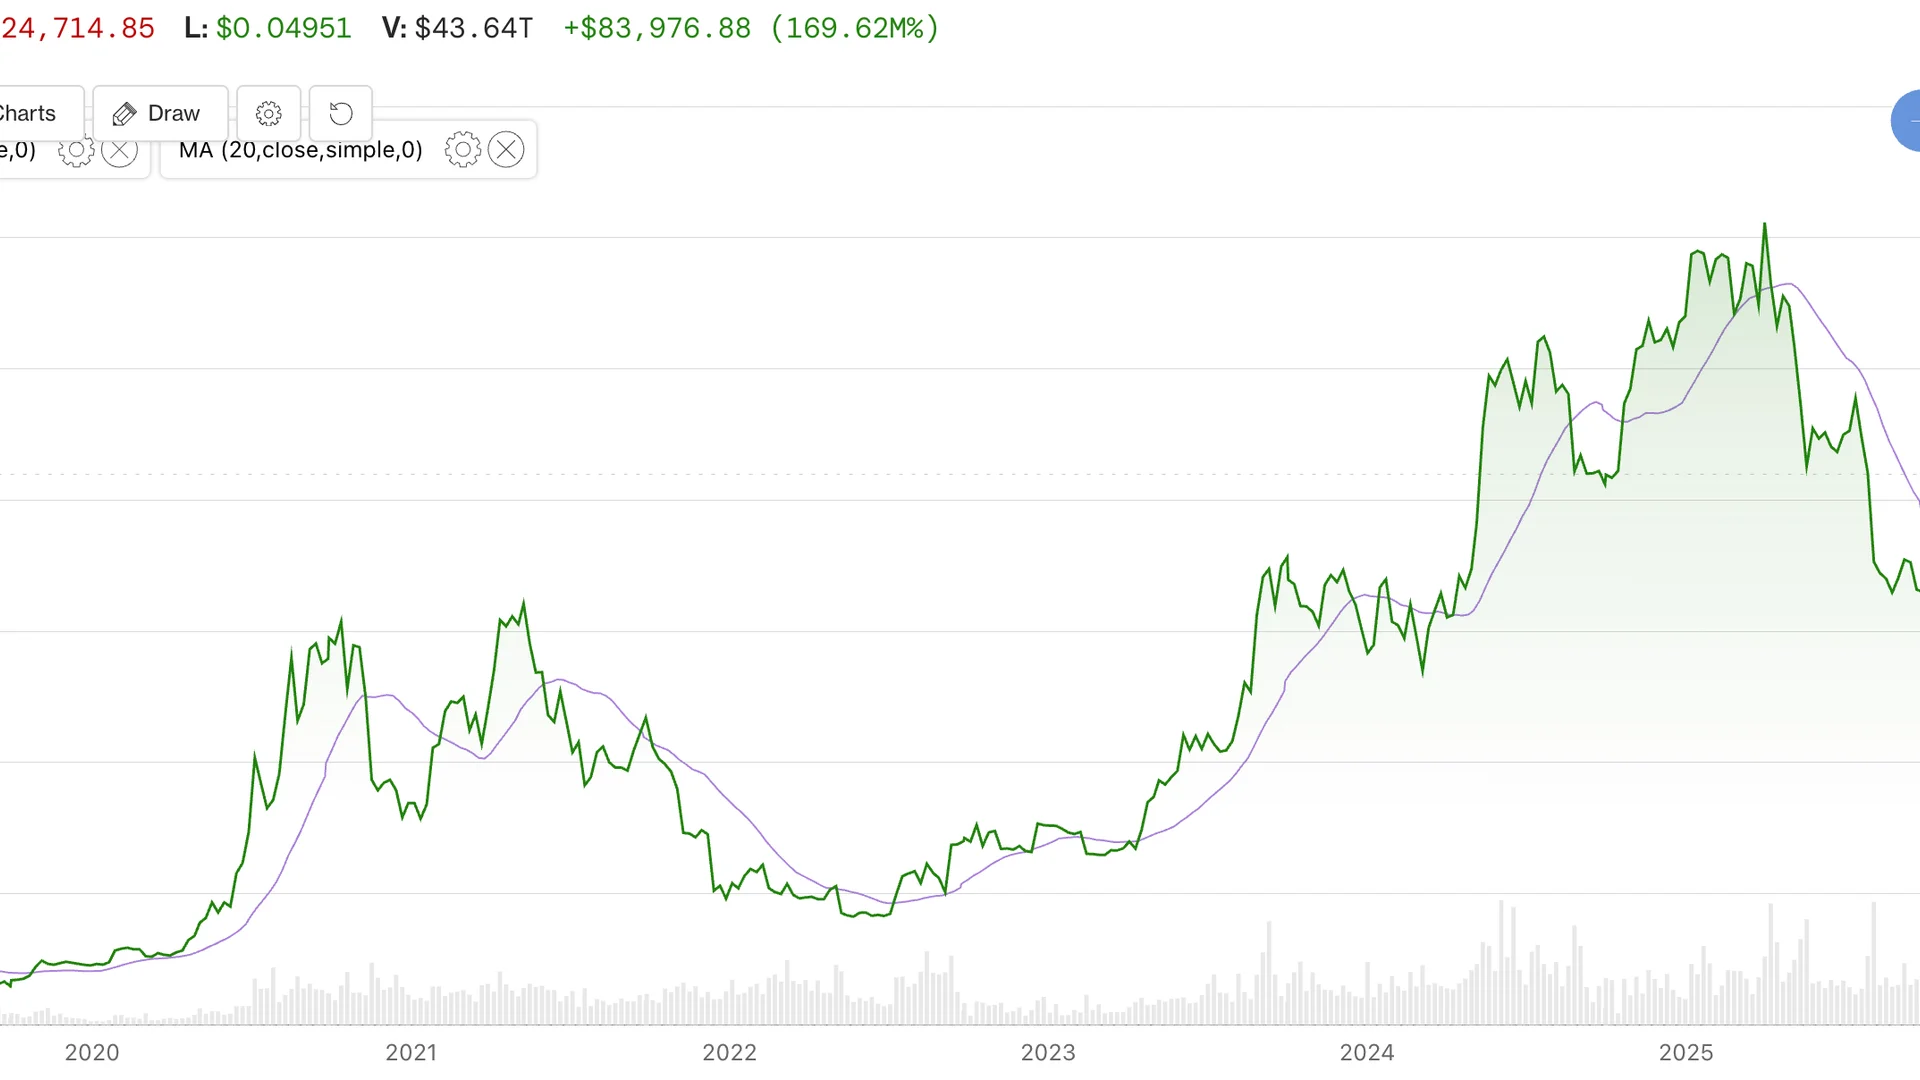



Bitcoin rose above its 365-day moving average near $80,900 on Sept. 22, reclaiming the level for the first time in 310 days. Altcoin Pro Research found that Bitcoin was higher 12 months later in all five previous cases where it regained the average after spending at least 90 days below it. Those gains ranged from about 59% to more than 1,400%.
Why it matters
The historical pattern is encouraging but not decisive. When Altcoin Pro included shorter periods below the average, it found failed breakouts in July 2018 and March 2022. Bitcoin then fell about 27% and 59%, respectively, within 90 days.
Altcoin Pro founders Ryan Horst and Joni Zhuleku said the 365-day average is a signal, not a guarantee. Their longer-term bullish view depends more on Bitcoin holding above its 200-day average, which stood near $70,800 in their calculations. Bitcoin was roughly 19% above that level before a modest dip over the prior 36 hours.
Market impact
The 200-day average reacts faster to market changes than the 365-day measure. Altcoin Pro said the 200-day average had already turned constructive in mid-August, while the 365-day average was still falling and remained closer to the market price.
Bitcoin also formed a golden cross on Sept. 8, when its 50-day average moved above its 200-day average. The signal has a mixed record on its own, but analysts view this setup as more constructive because Bitcoin had spent 293 days below the 200-day average. The next test is whether the recent selloff pushes Bitcoin back toward that level.

Frequently asked questions
-
What level did Bitcoin reclaim on Sept. 22?
Bitcoin rose above its 365-day moving average near $80,900 on Sept. 22, reclaiming it after 310 days below the level.
-
How did Bitcoin perform after the five previous comparable recoveries?
Bitcoin was higher 12 months later in all five previous cases. The gains ranged from about 59% to more than 1,400%.
-
Why is the 200-day average more important than the 365-day average?
The 200-day average reacts faster to market changes. Altcoin Pro said Bitcoin’s longer-term bullish case depends more on holding above that measure, which stood near $70,800.
-
What happened after the failed Bitcoin breakouts cited by Altcoin Pro?
Failed breakouts in July 2018 and March 2022 were followed by declines of about 27% and 59%, respectively, within 90 days.
-
What does Bitcoin’s Sept. 8 golden cross indicate?
Bitcoin’s 50-day average crossed above its 200-day average on Sept. 8. The signal has a mixed standalone record, but analysts viewed this setup as more constructive after 293 days below the 200-day average.
 TheBlock
 Crypto News
 Glassnode
 WatcherGuru