What does it mean to value an NFT collection with on-chain data?
Valuing an NFT collection with on-chain data means starting with public blockchain records instead of with vibes, influencer threads, or the current floor price. On-chain data shows who holds the tokens, how they moved, what they sold for, and whether those trades look broad or artificially narrow. It does not tell you whether the art is good, the community is healthy, or the next buyer will care. Those are separate questions.
The point is not to turn an NFT into a perfect spreadsheet. The point is to strip out some of the illusion. A collection can have a loud social feed, a fast-moving floor, and still be weak if most of the supply sits with a few wallets, if the same addresses keep trading it to themselves, or if the sales data is too thin to mean much. That is why any serious how to read NFT collection health process should begin with holder structure and real trading activity.
Think of on-chain valuation as a filter, not a verdict. It helps you answer a smaller question first. Is there evidence of real demand, or is the price mostly a story built on a few visible trades? Once you know that, your own judgment about culture, utility, art, and brand has a better base to stand on.
What can go wrong before you trust the numbers?
The biggest risk is assuming that every sale on a marketplace reflects a genuine buyer. It does not. NFT markets have a long history of wash trading, where wallets that are linked to the same actor trade assets back and forth to inflate volume, create artificial momentum, or farm incentives. A floor price can look active while the actual buyer base stays tiny. That is one reason how to spot fake NFT volume matters before you call any collection undervalued or overheated.
Another risk is mistaking liquidity for strength. A collection may show a burst of volume around a mint, a reward campaign, or a social trend, then fade fast when incentives change. Many collections that looked hot in the moment later revealed thin demand, weak retention, and a small set of repeat traders. Historical NFT wipeouts were often not mysterious. They were the result of shallow ownership, overextended prices, and no real second layer of buyers waiting underneath the first wave.
There is also platform risk. Marketplace data can be incomplete, delayed, or shaped by how a site defines a sale. OpenSea and Blur do not always present the same picture of volume, because each platform has different indexing, aggregation, and trade coverage. If you do not know what a data source includes or excludes, you may be comparing apples to a filtered version of oranges.
- Wash trades can make a dead collection look alive.
- Airdrop farming can create short-term wallets with no long-term conviction.
- Incentives can pull in mercenary traders who leave as soon as rewards stop.
- Thin books can make one sale move the floor far more than it should.
Why holder count is not the same as unique buyer count
Holder count tells you how many wallets currently hold at least one item from the collection. Unique buyer count tells you how many distinct wallets have actually bought the collection over a time period. Those are related, but they are not the same. The difference matters because a collection can spread into many wallets through transfers, airdrops, or small repeat buys without attracting a broad set of independent buyers.
This is where holder count vs unique buyer divergence becomes useful. If holder count keeps rising while unique buyer count stays flat, the collection may be getting distributed without widening demand. That can happen when a few traders split inventory across wallets, when whales accumulate aggressively, or when a handful of buyers recycle tokens inside a small network. None of those patterns automatically mean fraud, but they do mean the headline holder number can be misleading.
On Dune or Etherscan, compare the number of holders to the number of unique buyers over the same time window. If the gap widens, ask why. Are new wallets showing up because genuine collectors are joining, or because the same cluster is using multiple addresses? Are sales getting broader, or are a few addresses dominating activity? The answer changes how much trust you should place in the apparent demand.
It also helps to look at holder age. If a collection has many wallets but most were acquired in one burst and never touched again, the holder count may be less meaningful than it looks. A healthy base usually shows some mix of long-term holders, active secondary buyers, and enough new entrants to keep the market from depending on a single cohort.
How concentration and cohort behavior change the value picture
One of the most useful ways to read an NFT collection is to ask who owns the supply, not just how many wallets own it. A collection with broad ownership is often less fragile than one where the top few wallets control a large share. That is because a concentrated collection can move sharply if one or two large holders decide to sell, list, or rotate out. The market does not need everyone to panic. It only needs a concentrated seller to hit a thin book.
Distribution Gini/cohort view is a practical way to think about this. The Gini coefficient is a simple inequality measure. Near zero means ownership is spread out. Closer to one means ownership is highly concentrated. A cohort view adds another layer by grouping holders or buyers by time, such as mint week, acquisition month, or pre- and post-hype periods. That shows whether early supporters are still around or whether the entire base is mostly newer, short-term money.
Neither measure is magic on its own. Some legitimate collections will still have concentrated ownership because whales prefer them, or because mint mechanics favored large buyers. The question is whether concentration is justified by market depth. If a collection is tightly held but trades actively across many independent buyers, that is one thing. If it is tightly held and only a few wallets keep setting the price, the apparent valuation is much more fragile.
One useful test is to compare the top holder share with the behavior of later cohorts. Do newer buyers keep holding, or do they churn quickly? Are early wallets still present after the initial excitement fades? A collection with durable cohorts often handles shocks better than one that is always being handed from trader to trader. That does not make it safe. It just makes it more believable.
Why median sale price often beats mean sale price
Sale price is one of the easiest metrics to misuse. The mean, or average, is pulled upward by a few very high sales. The median is the middle sale, which usually tells you more about what a typical buyer paid. In NFT markets, where one or two rare traits can spike the average, the median is often the more honest number.
Why median beats mean in NFT sales
If a collection has many sales around 0.3 ETH and one grail sale at 20 ETH, the mean can make the collection look much richer than the everyday market suggests. The median stays closer to the typical transaction. That does not mean the rare sale is irrelevant. It means you should not let an outlier define the whole collection.
This matters even more when liquidity is thin. In a low-volume collection, a single expensive purchase can distort the chart and the social narrative around it. Always check how many sales sit behind the statistic. A median built on 500 sales means far more than a median built on 12.
When you compare sales, normalize in the collection’s native currency first, then translate to USD only if you need a broader market lens. ETH and SOL move, sometimes sharply. A collection can appear to be growing in dollar terms even if the token price barely changed, or it can look flat in USD while the native token value of the asset is holding up. That is why native-denominated analysis is often cleaner for relative value.
Sales history also needs context from listing depth. If the floor is rising but there are almost no listings above it, the collection may simply be illiquid. Illiquidity can lift the median in the short run, but it can also trap buyers who discover there is no real exit.
Do royalties and marketplace rules change the value of a collection?
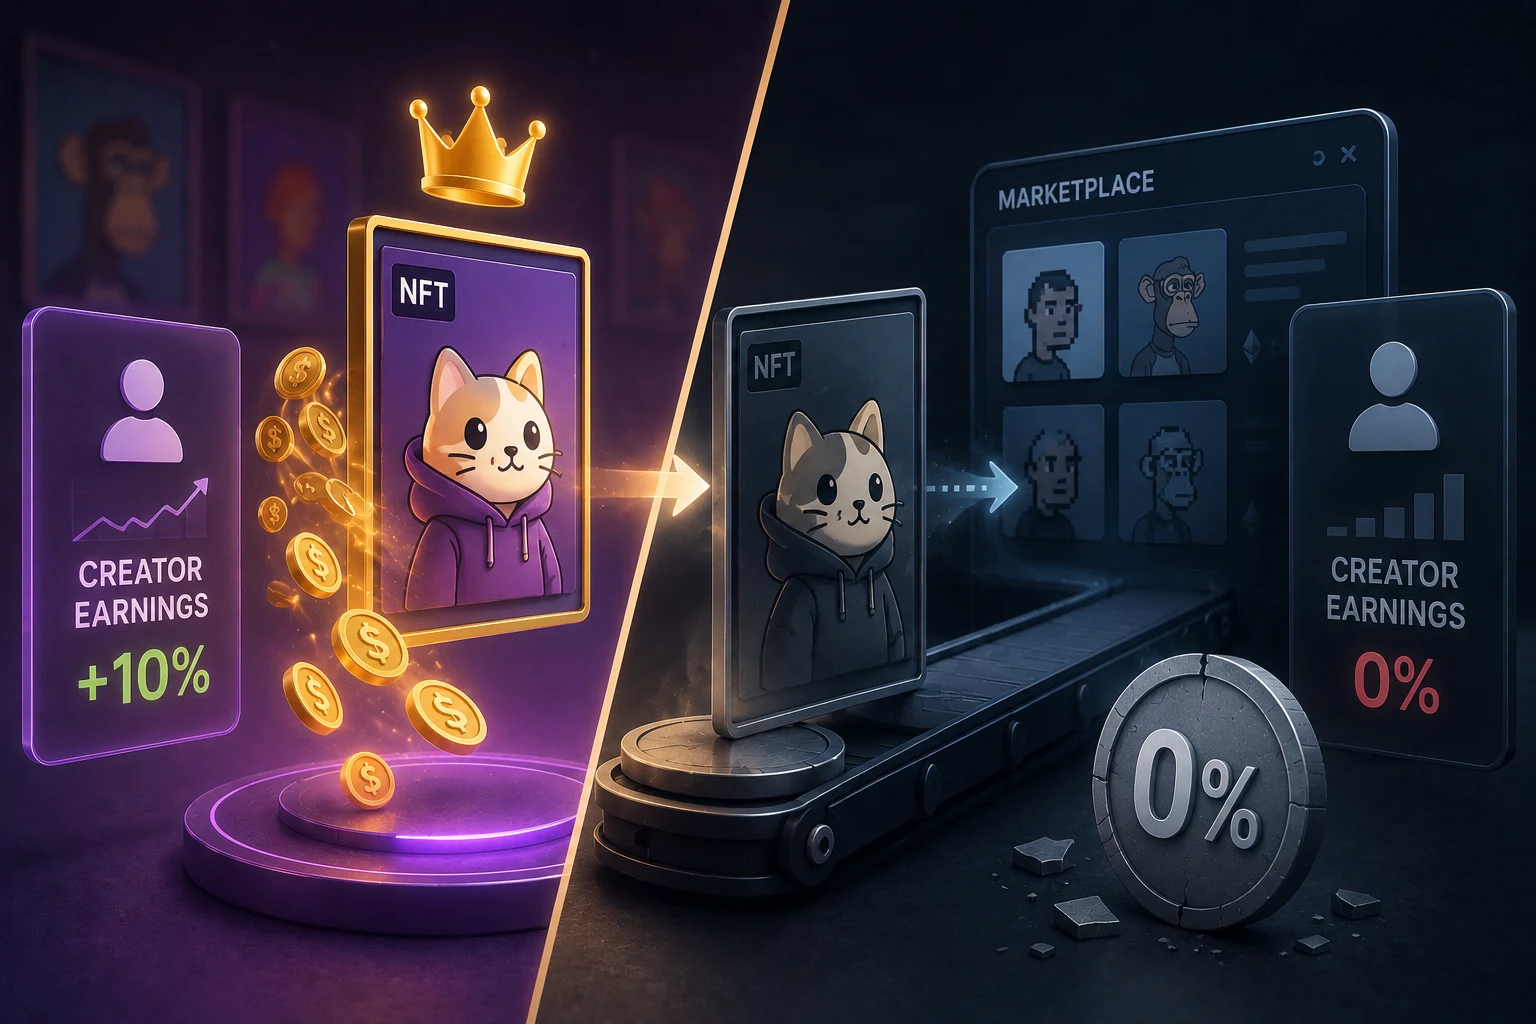
Yes, but in a more indirect way than many beginners expect. Secondary sale royalty enforcement affects creator revenue, community incentives, and sometimes the long-term ability of a project team to keep building. But royalties are not a guarantee of quality, and the market has repeatedly shown that traders will route around fees when they can. If a collection depends on ongoing creator income, weak enforcement can matter a lot.
On some marketplaces, royalties are enforced more strictly than on others, and on-chain enforcement is not always possible in the same way people assume. A collection may have a stated royalty rate, but actual payment can vary by venue, by trade path, or by whether the marketplace honors the fee at all. That means one volume chart can hide a revenue problem. The sales may be real, yet the ecosystem economics may still be weaker than they appear.
For valuation, the key question is not only whether royalties exist. It is whether they are actually collected often enough to support the project’s behavior over time. A creator who cannot reliably capture secondary revenue may have less budget for development, moderation, art, or perks. That does not automatically reduce floor price, but it does change the risk profile. Value is partly about what can be sustained, not just what can be sold today.
It is also a reminder to separate token-level market behavior from project-level health. A collection can have strong trading and weak economics, or weak trading and strong long-term community retention. On-chain data helps you see the first part. It does not finish the job for you.
How to detect wash trading and compare marketplace data the right way
Wash trading is one of the most important distortions to understand. It happens when the same economic actor, or a tightly linked cluster of actors, trades NFT items among wallets they control to manufacture volume. The point can be to attract attention, improve ranking, trigger incentives, or create the impression of demand. Wash-sale detection heuristics are not perfect proofs, but they can flag suspicious patterns quickly enough for a human to investigate.
Common wash-trade clues
- The same wallets keep buying and selling the same collection in a loop.
- Trades happen at nearly identical prices, with very short holding periods.
- Wallets are newly funded by the same source before the trade cycle starts.
- A small cluster accounts for an outsized share of all volume.
- Sales appear in one venue but do not match broader on-chain transfer patterns.
None of these signals proves manipulation by itself. A real trader can also buy and sell quickly. A whale can move multiple wallets for operational reasons. That is why heuristic screening is about pattern recognition, not courtroom certainty. You are trying to separate likely organic activity from volume that is too neat to trust.
Marketplace data adds another layer of caution. The phrase marketplace API caveats (OpenSea vs Blur) matters because each marketplace can report different trade subsets, different timestamps, and different volume definitions. Some trades may be aggregated, some delayed, and some excluded if they happen off-platform or through a route the API does not fully capture. Blur can overrepresent active trader behavior, while OpenSea can understate activity that never passed through its own reporting lens. The exact issue changes over time, so never treat one API as the full market.
The practical move is to cross-check. Use Dune for a broader chain-level query, Etherscan for raw transfer history, and marketplace data as a behavioral layer rather than a final verdict. If the numbers disagree, ask whether the disagreement is actually the story. Sometimes the market is fragmented. Sometimes the data source is incomplete. Sometimes the volume was never real enough to begin with.
What should a buyer actually do with these metrics?
Use the data to avoid bad decisions first, then to shape your thesis. A healthy workflow is to start with holder distribution, unique buyers, sale quality, and liquidity depth before you ever ask whether the art is undervalued. That order matters because a beautiful thesis built on fake or thin activity is still a weak thesis.
Here is a simple practical checklist you can run on Dune, Etherscan, and marketplace dashboards before making a decision:
- Compare holder count with unique buyer count over the same period.
- Check the top holder share and the broader distribution Gini/cohort view.
- Compare median sale price with mean sale price.
- Look for wash-trade clues, including wallet loops and same-source funding.
- Review whether secondary sale royalty enforcement is actually happening.
- Cross-check OpenSea and Blur data instead of trusting one feed.
If holder count is growing but unique buyers are not, if concentration is high, if the median is weakening, and if the volume looks like it came from a few wallets chasing each other, the collection is probably riskier than the headline suggests. If ownership is broad, cohorts persist, sales are not all driven by outliers, and the volume survives a wash-trade screen, then you at least have a more credible base for further research.
That still does not tell you what the asset should be worth in the future. No dataset can do that with certainty. What it can do is stop you from paying for noise. After the data work, your subjective take has a better chance of being about the collection itself instead of about a misleading chart.
How to follow NFT valuations the smart way
NFT markets move fast and the news around them moves even faster. Tracking holder shifts, royalty changes, marketplace rule updates, and suspicious volume by hand is a losing game. Zippfeed surfaces NFT headlines with sentiment scoring, bullish, neutral, or bearish, plus an importance rating, so you can separate signal from noise and connect news flow to the on-chain metrics you already checked. That makes it easier to react to real changes without getting pulled in by every loud post.
If you want a cleaner read on a collection, pair your on-chain work with how to follow NFT sentiment without getting trapped by hype. Data tells you what happened. Sentiment tells you how the market is interpreting it. Zippfeed helps you watch both at once, so you can spot when a collection’s story is improving, when it is fading, and when the market may be reacting before the numbers fully catch up.


 Lookonchain
 WuBlockchain
 Crypto Capital Venture