What do NFT floor price red flags actually mean?
The floor price is simply the cheapest NFT listed in a collection. It is useful as a snapshot, but it is not the same as fair value, and it is not proof of healthy demand. A floor can be nudged by one seller, a cluster of bots, or a very small amount of capital on ETH or SOL.
That is why thin floor vs deep liquidity matters so much. A thin floor means only a few listings stand between you and a much lower price, while deep liquidity means there are many sellers, many buyers, and enough real activity for the market to absorb shocks. Thin floors can look stable right up until they gap down.
The checklist in this article is meant to answer a simple question. Is the collection being supported by real demand, or just by temporary hype and a tiny amount of inventory? If you want a refresher on the data side, pair this with reading on-chain wallet activity and how NFT liquidity works.
Why a clean-looking floor chart can still be dangerous
The biggest mistake is reading a rising floor as a sign that the market is healthy. In a PFP, short for profile-picture NFT, the chart can hold up while insiders quietly exit. Buyers see a strong price, but the actual exit liquidity is often tiny, which means the first serious sell wave can do a lot of damage.
Wash trading is another way a floor can look stronger than it is. Wash-trading volume signals show up when the same wallets buy and sell between themselves, or when a small wallet cluster creates the appearance of activity. That volume can fool casual traders, but it does not create new demand, and it usually fails once the spoofed activity stops.
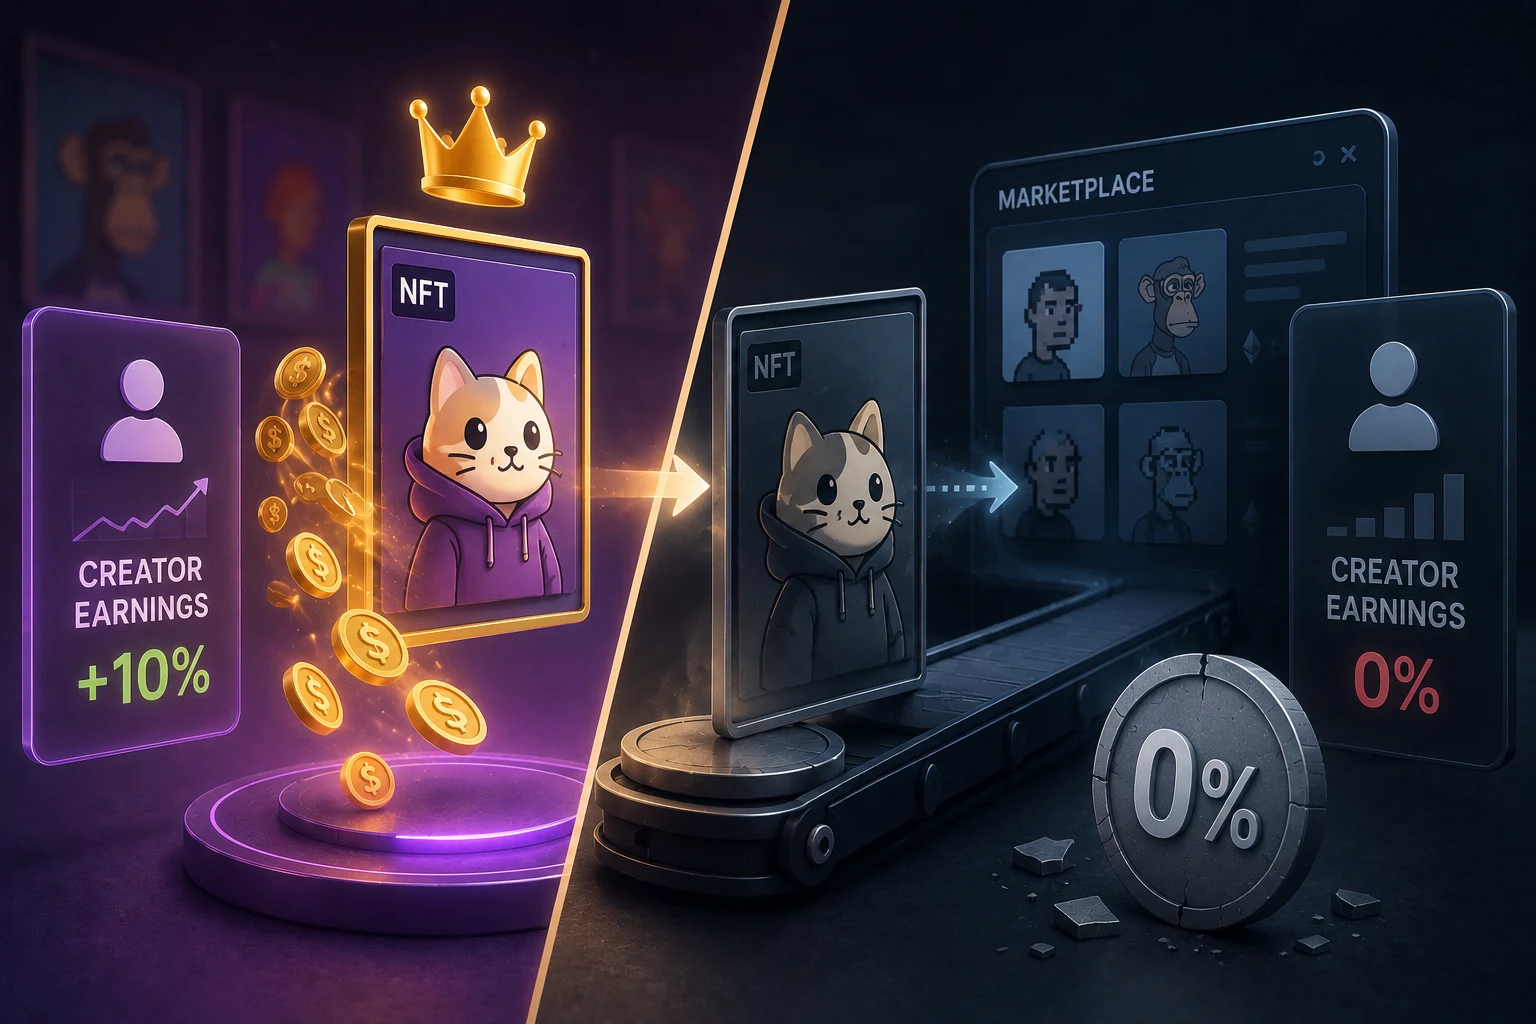
Two more risks can break the market without warning. Royalty enforcement changes can alter the economics of a collection if marketplaces stop enforcing creator fees or switch rules, and a sudden freeze of marketplace listings can hide the true supply picture if sellers pull items at the same time. A freeze can be technical, but it can also be a sign that holders expect bad news.
The checklist: on-chain signals that often break a floor
Use the next list as a quick screen, not as a guarantee. One weird signal can be noise. A cluster of them usually means the floor is being held up by weak structure, not by broad demand.
- Thin floor vs deep liquidity. If the cheapest listings are only a few NFTs deep and bids disappear after one sale, the floor can slide fast. That is how many PFP rugs begin, because one seller can knock the market down before buyers react.
- Wash-trading volume signals. If volume spikes but the same wallets keep trading with each other, the chart may be inflated. Late buyers can end up chasing activity that was never real demand in the first place.
- Holder concentration. If a small group controls a large share of supply, one coordinated exit can crush the floor. This is especially dangerous when social channels still look busy but ownership is concentrated in a few addresses.
- Transfer patterns of the deployer wallet. If the deployer wallet keeps sending NFTs or proceeds into fresh wallets, that can signal a slow dump by the team. Normal project activity exists, but repeated transfers right before listings weaken are a serious warning.
- Royalty enforcement changes. If creator royalties are suddenly not enforced, or the collection shifts marketplaces in a way that changes fee rules, the economics of the floor can change overnight. Buyers who thought the market had one cost structure may find a very different one.
- Sudden freeze of marketplace listings. If listings vanish all at once, do not assume demand improved. The supply may be hidden temporarily, and once it returns the real sell wall can be lower than the old floor.
Another useful clue is the relation between sales and listings over time. If sales are shallow, bids are thin, and a few wallets keep propping up the price, the collection may look active while it is actually fragile. That is why the checklist is stronger when several items line up at once.
How these patterns turn into real losses
A PFP rug rarely starts with a dramatic crash. More often, the project looks healthy enough that holders keep posting about the floor while the actual market depth shrinks. When the first wave of selling hits, the highest bids vanish, the next listings get hit, and the chart drops faster than most people expect.
A gradual dump by team wallets is even harder to spot. The creators or insiders do not need to sell everything in one move. They can spread supply across fresh wallets, wait for a pump in interest, and unload into every small bounce. To outside holders, it looks like normal volatility. In reality, it is a slow transfer of risk from insiders to buyers.
These failures are not unique to any one chain. On ETH, the weakness might show up as a few large holders controlling the floor and using marketplace behavior to manage appearances. On SOL, the problem might be faster trading, thinner bids, or bots that make the market look deeper than it is. The chain changes, but the lesson does not: a headline floor is not the same as durable demand.
What to do before you click buy
Start with the basics. Look at how many items are listed, how fast they sell, who holds the largest chunks of supply, and whether the deployer wallet has moved in a suspicious way. If the market is thin, the cheapest listing is not a bargain signal. It is often a sign that you might be the next exit liquidity.
Then check what changed in the last day or three. Did volume jump without new buyers? Did royalty rules change? Did listings vanish? Did one or two wallets keep buying the floor over and over? If three or more signals fire, the safer choice is to wait. The point of the rule is not to predict a crash. It is to avoid buying a collection whose structure is already weak.
That rule can feel conservative, but it is usually cheaper than being stuck in an illiquid position. A floor that looks cheap can still be expensive if you cannot exit without taking a large loss. In NFT markets, missing a move is often less costly than being early to a trap.
Stay ahead of NFT floor risk with Zippfeed
NFT floors move fast and so does the news around them. Tracking wallet shifts, marketplace changes, and creator updates by hand is a losing game. Zippfeed surfaces NFT headlines with sentiment scoring, bullish, neutral, or bearish, and an importance rating, so you can spot real risk signals faster and avoid confusing noise with demand.


 WuBlockchain
 Crypto Capital Venture
 Lookonchain
 TheBlock